
New Year's Links
The Conglomerate Discount. The VIX is Becoming Increasingly Leptokurtic.

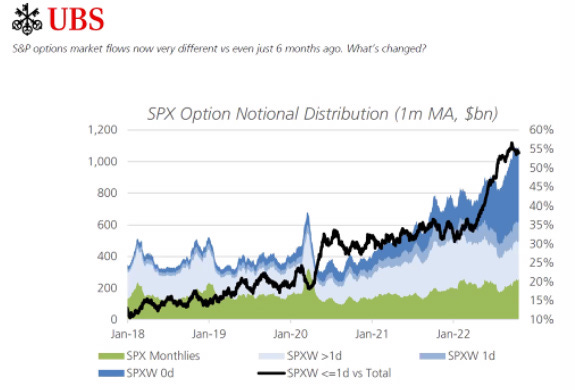
Chart of the Week - SPX Option Notional Distribution
The Conglomerate Discount: A New Explanation Based on Credit Risk
by Ammann, Manuel and Verhofen, Michael
We present a simple new explanation for the diversification discount in the valuation of firms. We demonstrate that, ceteris paribus, limited liability of equity holders is sufficient to explain a diversification discount. To derive this result, we use a credit risk model based on the value of the firm's assets. We show that a conglomerate can be regarded as an option on a portfolio of assets. By splitting up the conglomerate, the investor receives a portfolio of options on assets. The conglomerate discount arises because the value of a portfolio of options is always equal to or higher than the value of an option on a portfolio. The magnitude of the conglomerate discount depends on the number of business units and their correlation, as well as their volatility, among other factors.
Is the VIX Becoming Increasingly Leptokurtic Due to the Changing Derivatives Market?
by Ambrus Capital
We hold the belief that during the next “extreme crash” investors will see the VIX re-price to levels that have not been seen since its inception. This repricing will largely be due to the changing landscape of the derivatives market. The increased use of very short-dated SPX options coupled with market maker concentration is likely making the VIX as sensitive as ever.
Why does all this matter? We believe that the increasing kurtosis (and therefore the increasing convexity) in the VIX creates excellent opportunities for using deep out of the money derivatives from the VIX complex for tail hedging an equity portfolio. Our data leads us to believe that this changing spot- vol relationship makes the tail options in the term structure relatively underpriced in comparison to the belly of the vol surface. A skilfully designed portfolio can take advantage of this repricing of volga in the tails of the term structure, generating large profits for investors during a market crash.
Persistence of Margins - Unlike Growth, Margins Persist
by Greg Obenshain, Verdad
In a recent piece, "Persistence of Growth," we showed that growth is far less persistent than many might suppose. In fact, it is not persistent at all. As a result, valuation multiples tend to mean revert. This turns out to be useful because it is the mechanism of action that powers returns in a value strategy. But multiples do not mean revert fully, and in "Fair Multiples," we argued that the best indicators of whether a future multiple should be (slightly) higher or lower than the average market multiple are profit margins and free cash flow conversion.
Here the message is even clearer. According to the data above, high return on capital persists, and higher profitability is better. The message to the analyst modeling company financials is somewhat heartening. While we’ve been adamant that growth is not persistent and that high growth rates should not be carried out for many years, margins and returns on assets are relatively sticky. Very high margins and returns on capital do mean revert, but slowly. While growth may be ephemeral, profitability is not.
Anomalies and Their Short-Sale Costs
by Muravyev, Dmitriy and Pearson, Neil D. and Pollet, Joshua Matthew
We find that short sale costs eliminate the abnormal profits generated by asset pricing anomalies. While many anomalies persist out-of-sample, they cannot be profitably exploited due to stock borrow fees. Using a comprehensive sample of 162 anomalies, we show that the average of these long-short anomalies earns a significant 0.15% per month before costs. However, this average is -0.02% once portfolio returns are adjusted for stock borrow fees. Moreover, the anomalies are not profitable before accounting for borrow fees if the stocks with high borrow fees, 12% of all stocks, are excluded from the analysis. Thus, short sale costs explain why these anomalies exist despite arbitrageurs’ best efforts to exploit them.
Why Naive 1/N Diversification Is Not So Naive, and How to Beat It?
by Yuan, Ming and Zhou, Guofu
To understand theoretically why the 1/N rule is very difficult to beat, we show that the usual estimated investment strategies are biased even asymptotically when the dimensionality is high relative to sample size, and the 1/N rule is optimal in a one-factor model with diversifiable risks as dimensionality increases, irrespective of the sample size. We also explore conditions under which the 1/N rule can be beaten. We find that combining the 1/N rule with the popular estimated rules can improve its performance when N is small, and combining it with anomaly or machine learning portfolios can also improve its performance when N is large.
Why Stock Price Jumps? The Role of Disagreement and News
by Fallahgoul, Hasan A and Fallahgoul, Hasan A and Lin, Xin
We empirically explore the role of investor disagreement and news for various types of stock jumps, where the dynamic of stock returns is captured by a contagion model. Our disagreement measure is derived from more than 173 million tweets from a social media investing platform, StockTwits, for about 3,000 publicly-traded companies. Consistent with theoretical disagreement models, we find that investor disagreement is significantly associated with jumps, including time-variation in estimated jump intensity and realized jump-size distributions. Jump features are also explained through news, however jump intensity explainability by investor disagreement is about four times higher than news. Furthermore, the relationship varies across different types (signed, contagious and non- contagious) of jumps. Our results imply that contagion is more likely when the level of disagreement is higher.
The Rising Importance of Aggregate Earnings for Asset Prices
by Sadka, Gil and Sadka, Ronnie and Tseng, Ayung
This paper re-examines the earnings-returns relation in a framework that unifies the cross section and time series. While prior studies argue that earnings become less important for asset prices, they rely on cross-sectional analyses while ignoring time-series considerations. In contrast, time-series analyses indicate that the firm-level earnings-returns relation has not declined. When including both firm and aggregate earnings in a rolling-window panel setting, firm earnings exhibit a declining coefficient whereas aggregate earnings exhibit an increasing trend (switching from negative to positive). These trends are explained by an increase in firm connectedness and a decline in the predictability of aggregate earnings.