The bezzle cannot be quantified, and it cannot even be proven to exist until after the fact. But while that makes it useless as a concept for a form of economics that values precision over accuracy, this doesn’t mean that its impact should be ignored. The balance sheet matters, and when there is a significant (albeit temporary) divergence between the perceived value of assets in an economy and their future contribution to the production of real goods and services—whether this divergence is created by fraud, irrational exuberance, or malinvestment and other forms of nonproductive investment—this divergence will change economic behavior and activity in ways that are not sustainable.
This is especially likely to be the case when an economy is locked for many years into the systematic creation of bezzle. When that happens, the economy will experience a period during which economic activity overstates the real underlying growth in productive capacity, followed by a period in which this overstatement is eliminated.
While increased dispersion in interest rate sensitivities across sectors and styles highlights the importance of stock-bond correlation in the cross- section of U.S. stock market returns, investors rarely seek exposure to sectors or style factors in their pure form (e.g., through portfolios comprising 100% long/short exposure to value or 100% financial stocks). This raises the following question: How have “investable” portfolios been affected by this increased dispersion?
To address that question, we computed Treasury betas for select investable indices, using the broad universe of U.S. stocks constituting the Fama/French Total US Market Index to compute equity market beta. Figure 5 presents Treasury betas for two periods 20 years apart.
Consistent with our other findings, Treasury betas for these investable indices experienced a large increase in dispersion between the two periods. The approximate spread in Treasury betas among these indices jumped from 0.20 (-0.15 to 0.05) to more than 1.35 (-0.65 to 0.70).
The magnitude of these differences is economically meaningful. A Treasury beta of 0.70, for example, suggests that if the 10-year Treasury note returns -5% because of interest rate changes (a slightly less than one standard deviation move on an annualized basis over the 2001–2021 period), the relevant index would underperform its equity market beta by 3.5%.
At a more granular level, this trend also has implications for performance attribution. Investors often equity beta-adjust sector returns when considering sector-specific investments. Given the increased dispersion in interest rate sensitivities, it is instructive to consider how sector returns are affected when adjusting for equity and Treasury betas over the past dozen years. The performance presented for the technology and utilities sectors in Table 1 stands out in that respect.
The excess return of the technology sector is pared down considerably after adjusting for its equity market beta, and further still when adjusting for Treasury beta. Although technology was the top-performing sector over the period on an unadjusted basis, it falls to third after accounting for those betas. The utility sector return, by contrast, receives a substantial boost when adjusting for equity beta, but more than half of that gain dissipates after adjusting for Treasury beta.
In my opinion, the non-GAAP Rule-of-40 operating model doesn’t work unless the market believes the business can grow 30-40% to support SBC costs. I suspect most companies are spending for 30-40% growth anyway, but aren’t willing to publicly commit to that growth target (and be accountable to it). This creates an air pocket where a company’s Rule-of-40 operating model is essentially guiding value destruction if it’s to be believed.
Now, if a strong growth trajectory isn’t realistic, non-GAAP operating margin needs to be closer to 30-35% with SBC meaningfully cut to achieve an “economic-reality adjusted” Rule-of-40. Basically, a restructuring needs to happen or strategic alternatives is initiated with the acquirer doing the restructuring (with selling executives benefitting from accelerated vesting termination due to change-of-control and the relief of not restructuring in public).
Behavioral finance lacks direct evidence linking agents’ beliefs to their behaviors. Motivated by revealed preference theories, I provide such evidence using mutual fund stock holdings. Assuming that investors' expectations are consistent with their investment decisions, I relate fund managers’ stock holdings to past factor returns and document four facts about belief formation: 1. In contrast to belief extrapolation, a substantial fraction of mutual fund managers act as contrarian investors who expect lower factor returns after a good factor performance; 2. Distinguished from fund style investment strategy, fund catering strategy and fund risk preference, the two trading patterns imply fund manager expectation biases, which are either extrapolative belief or contrarian belief. Both extrapolator and contrarian fund managers overweight more recent factor returns then distant factor returns when forming their expectations; 3. The degree of contrarianism is highly correlated with future fund performance. The top (contrarian) managers outperform the bottom (extrapolative) managers by a return of 3.4% per annum after adjusted by FFC4 factor models; and 4. Exploring fund characteristics,I find contrarian managers are more experienced, charge higher expense ratios, and manage smaller US equity funds. Overall, my finding provides evidence for belief contrarianism---the opposite of belief extrapolation---as a general trait that is associated with superior investment management performance.
by Fang, Jing and Myers, Linda A. and Schmardebeck, Roy
We find that the perverse effect of equity incentives on financial misreporting is weaker for older chief financial officers (CFOs) than for younger CFOs. We attribute this to differences in risk preferences associated with age. Consistent with our attribution, we find that the difference is stronger when CFOs have greater discretion over accounting choices. Moreover, results from a difference-in-differences analysis using CFO transitions from younger to older CFOs show that hiring older CFOs alleviates the perverse effect of equity incentives on financial misreporting. In contrast, transitions from older to younger CFOs do not aggravate the perverse effect of equity incentives on financial misreporting. This is consistent with organizational arrangements set up under departing older CFOs constraining incoming younger CFOs from making aggressive accounting choices in response to their equity incentives.
This paper investigates the performance of option investments across different stocks by computing monthly returns on at-the-money straddles on individual equities. It finds that options with high historical returns continue to significantly outperform options with low historical returns over horizons ranging from 6 to 36 months. This phenomenon was found to be robust, as the authors tests included out-of-the-money options or delta-hedging the returns.Unlike stock momentum, option return continuation is not followed by long-run reversal. Significant returns remain after controlling for implied volatility and other characteristics. Abnormal returns also survive factor risk adjustment. Average option momentum returns are close to zero after paying the full bid-ask spread for options with below-median bid-ask spreads. Across stocks, trading costs are unrelated to the magnitude of momentum profits.
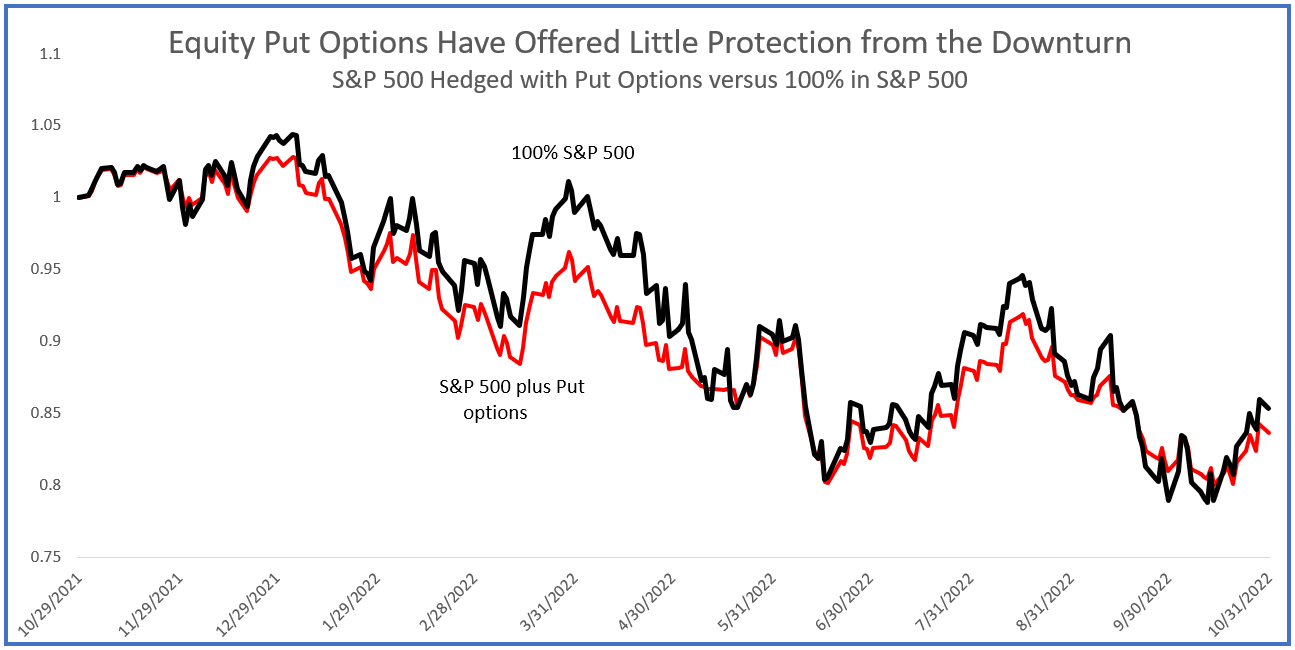
If you bought and rolled one-month put options on the S&P 500 to hedge an investment in that index, over the past year you’d have lost an extra 2% on top of the 15% loss from just holding the S&P 500 unhedged, not to mention the loss of your time spent managing the strategy. The Chicago Board Options Exchange (CBOE) makes this really easy to see, by publishing an index of daily returns on the S&P 500 hedged by buying and rolling 5% out-of-the-money put options. The index ticker is PPUT.